How to Monitor Consumed Memory From Python Processes
I have been debugging some issues lately where Python processes are running out of memory after running for some time, even days. Usually these issues are caused by some memory leak or maybe some high load on a given time that makes queues in your Python process to consume all the memory.
In order to identify and debug those issues, I found really useful a tool called memory_profiler which it used to monitor the memory consumption during runtime of a Python process.
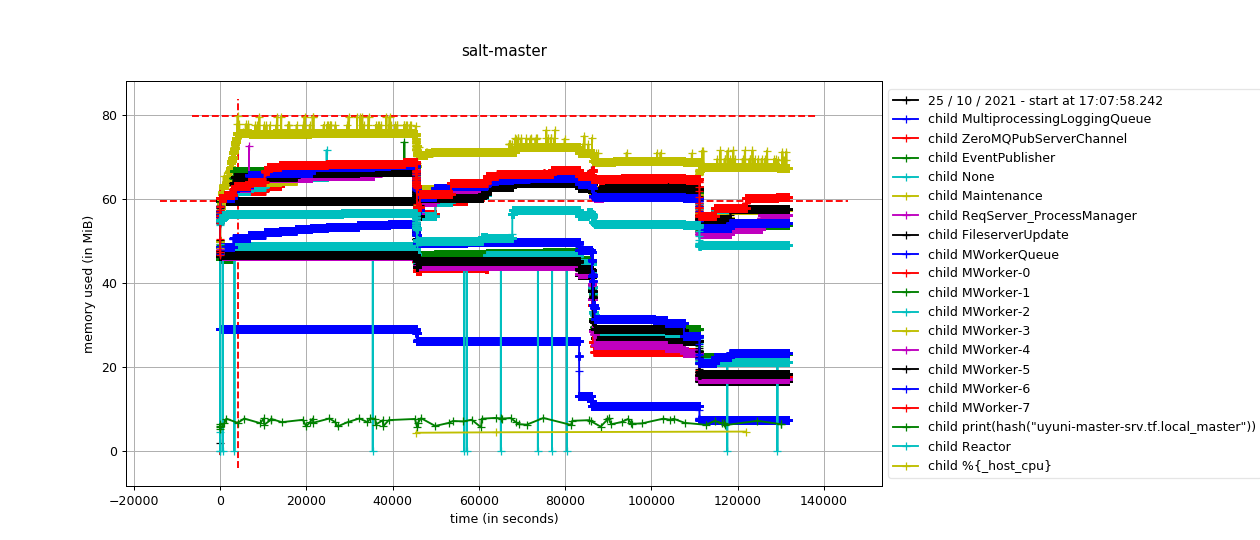
As you can see in the above picture generated by memory_profiler, this is the memory usage from a running “salt-master” over time, where each line represents one of the subprocesses created by Salt master daemon.
Here are some intructions how you can getting started and get you own graphs from your Python processes.
1. Install memory_profiler in your system using pip
# pip install memory_profiler
2. Additionally, you may want to install setproctitle in order to identify the classname which is handling each one of the subprocesses
# pip install setproctitle
3. Execute our Python program using mprof:
# mprof run -T 1 test-leak.py
This command starts our program and will also start dumping the memory usage into a data file.
We are using here an example test-leak.py script to produce a memory leak. Keep in mind it will consume all the available memory in your system.
The mprof run command additinally accepts some more paremeters. The most interesting ones are:
  --interval INTERVAL, -T INTERVAL
                        Sampling period (in seconds), defaults to 0.1
  --include-children, -C
                        Monitors forked processes as well (sum up all process memory)
  --multiprocess, -M    Monitors forked processes creating individual plots for each child (disables --python features)
  --exit-code, -E       Propagate the exit code
  --output FILENAME, -o FILENAME
                        File to store results in, defaults to 'mprofile_<YYYYMMDDhhmmss>.dat' in the current directory,
                        (where <YYYYMMDDhhmmss> is the date-time of the program start).
                        This file contains the process memory consumption, in Mb (one value per line).
If no output file is set, it will dump the data into a “mprofile_TIMESTAMP.dat” file.
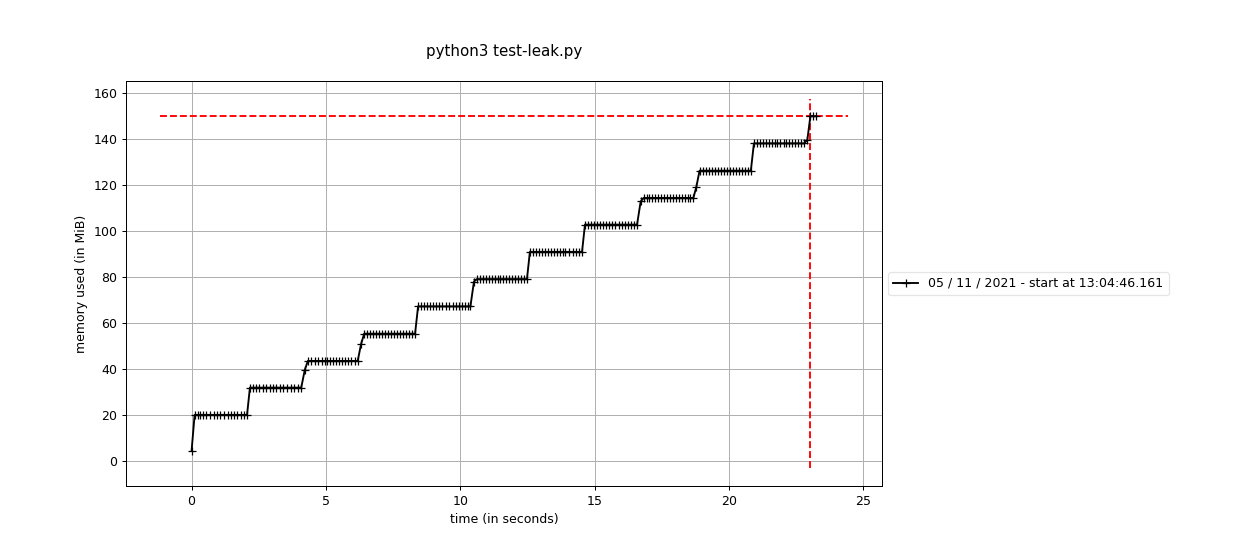
4. At any time, while your process is running, you can generate a graph with the current data:
# mprof plot -o image.png
You will get an image like this when your “test-leak.py” begin to run:
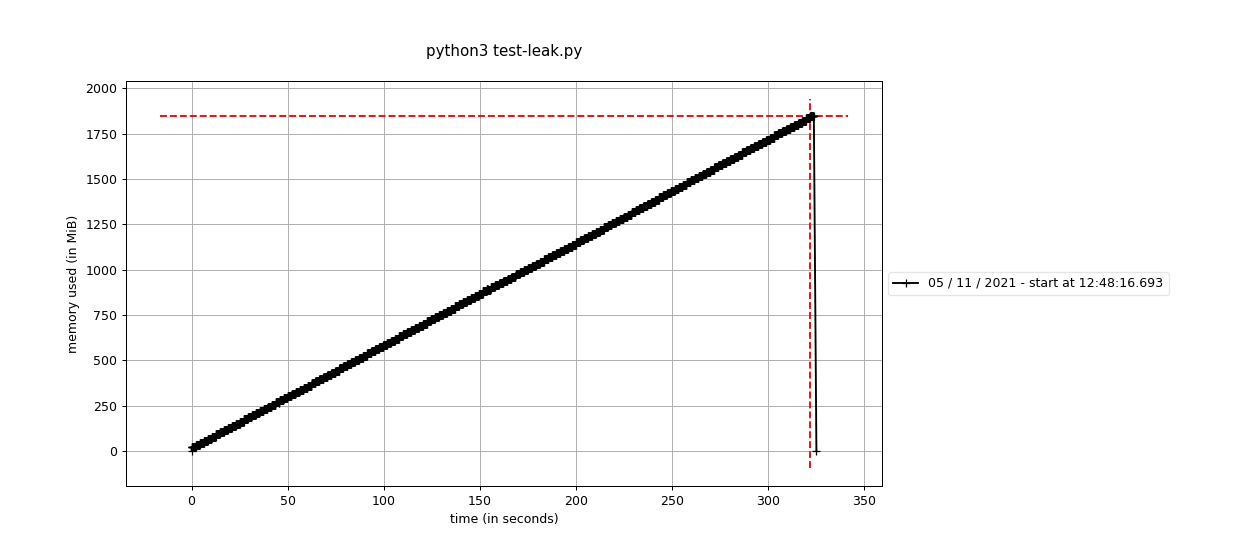
In my testing VM, after having the script running for some minutes, all available memory is consumed (2GB), and the process is killed:
5. Including child processes
We can tell mprof to also include the memory usage of the children processes. This is done using the -M flag:
For example, to get a memory usage graph for the “salt-master” process including the children, you can use:
# mprof run -T 1 -M salt-master
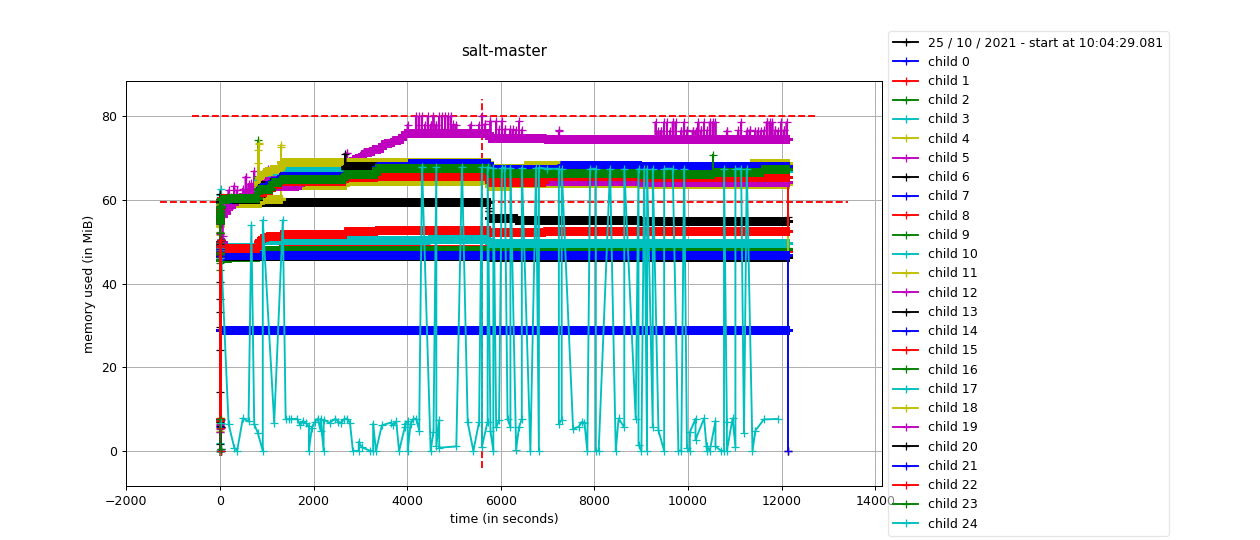
Alternatively you can use -C flag to simply sum all memory from child processes.
NOTE: In order to get children names into the graph, this patch is needed for memory_profiler.